
I recently read a blog post talking about a performance tuning tool called tracer_bullet.
There’s already a great tool for doing this work, though, called ruby-prof. It’s a C extension, so it isn’t going to work in JRuby (but JRuby already has great profiling tools available), but for people on MRI, it’ll work flawlessly.
Arbitrary Profiling
Profiling arbitrary Ruby code is as easy as something like this:
result = RubyProf.profile {
  # Some slow code here
}
open("callgrind.profile", "w") do |f|
  RubyProf::CallTreePrinter.new(result).print(f, :min_percent => 1)
end
This means that it’s pretty easy to abstract into a helper:
class ApplicationController
  def profile(prefix = "profile")
    result = RubyProf.profile { yield }

    dir = File.join(Rails.root, "tmp", "performance", params[:controller].parameterize
    FileUtils.mkdir_p(dir)
    file = File.join(dir, "callgrind.%s.%s.%s" % [prefix.parameterize, params[:action].parameterize, Time.now.to_s.parameterize] )
    open(file, "w") {|f| RubyProf::CallTreePrinter.new(result).print(f, :min_percent => 1) }
  end

  helper_method :profile
end
And then call it from your code (anywhere, but let’s demo a view)
<% profile "myview" do %>
  # Some code here
<% end %>
This will generate the appropriate callgrind file in your tmp/performance directory.
Request Profiling
So, extending this to full requests should be pretty straightforward. You could just do it in an around_filter, but there’s already a solution for you. This pattern is already wrapped up in request_profiler as a rack middleware. All you have to do is include it in your Gemfile:
gem 'request_profiler', :git => "git://github.com/justinweiss/request_profiler.git"
Then you can profile a request just by adding a query parameter:
http://foo.com/bar/baz?profile_request=true
This will generate a callgrind dump in tmp/performance, which you can then pull up with kcachegrind/qcachegrind.
Reading a dump
So now that you have your traces, what do you do with them? You probably want kcachegrind (for Windows/Linux) or qcachegrind (for OS X, install via homebrew).
To demo, I’m using publify, because it’s the first open source Rails app I could find. I know nothing about it. I just cloned and installed it:
git clone https://github.com/fdv/publify
cd publify
mv config/database.yml.sqlite config/database.yml
Added request_profile and installed:
echo "gem 'request_profiler', :git => 'git://github.com/cheald/request_profiler.git'" >> Gemfile
bundle install
Add the middleware to config/environments/development.rb:
config.middleware.insert 0, "Rack::RequestProfiler", :printer => ::RubyProf::CallTreePrinter
And start the server:
rails s
Logged in, and it’s time to profile!
http://192.168.4.139:3000/admin?profile_request=true
This generates a callgrind file for us. Opening it in KCachegrind gives us something like this:
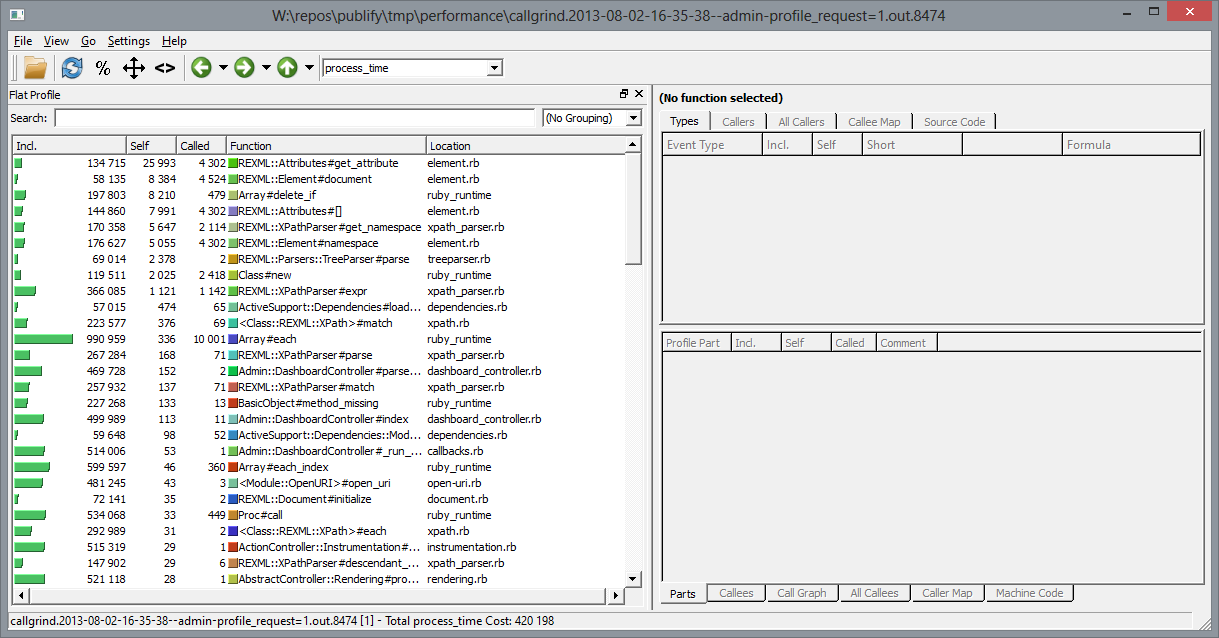
First things first, in the bottom, you’ll notice Total process_time cost: 420 198. This is in microseconds, which means that overall, this page took 420 milliseconds to run.
Second, I’ve sorted by the Self column. This shows me which functions the action spent the most time in. Incl. means the function plus its children. You’ll use both to track down slow bits.
So, at the top here, you see REXML::Attributes#get_attribute. It took almost 26ms, and its total runtime was 134ms, or about 32% of the total page runtime. I happen to know that REXML is slow and that you should always use Nokogiri instead because it is fast and awesome rather than slow and terrible (REXML was responsible for me almost completely writing off Ruby as a language, but that’s a story for another day).
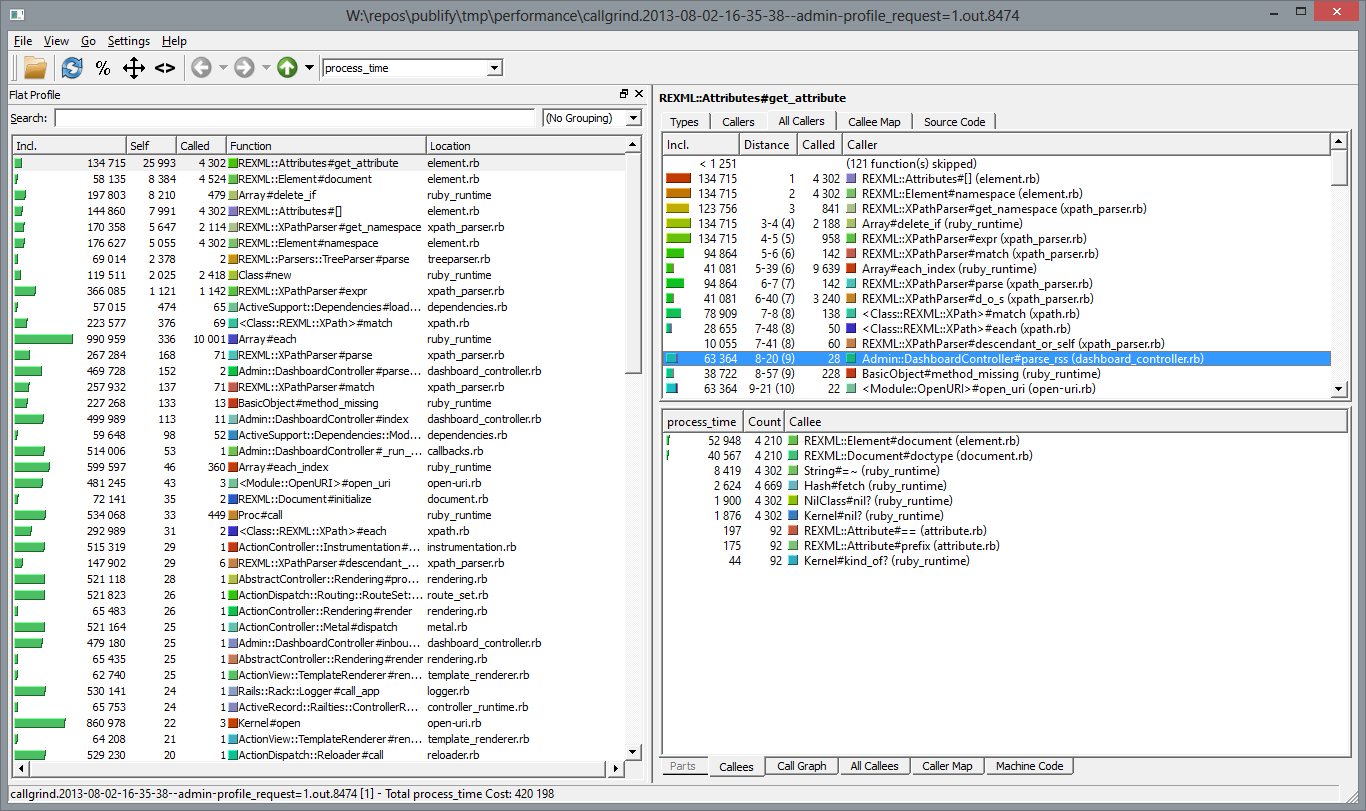
Clicking on the offending method gives me two intersting things here. I’m looking at the All Callees view, sorted by Distance. This is kind of like a stack trace, except that it includes all possible paths to this function. This is useful because it lets us figure out where in the application code this library code was invoked from. As you can see, I’ve highlighted the nearest application code to the method we’re looking at, which is Admin::DashboardController#parse_rss.
I can find that in the source code easily. It’s pretty standard REXML:
def parse_rss(body)
  xml = REXML::Document.new(body)

  items        = []
  link         = REXML::XPath.match(xml, "//channel/link/text()").first.value rescue ""
  title        = REXML::XPath.match(xml, "//channel/title/text()").first.value rescue ""

  REXML::XPath.each(xml, "//item/") do |elem|
    item = RssItem.new
    item.title       = REXML::XPath.match(elem, "title/text()").first.value rescue ""
    item.link        = REXML::XPath.match(elem, "link/text()").first.value rescue ""
    item.description = REXML::XPath.match(elem, "description/text()").first.value rescue ""
    item.author      = REXML::XPath.match(elem, "dc:publisher/text()").first.value rescue ""
    item.date        = Time.mktime(*ParseDate.parsedate(REXML::XPath.match(elem, "dc:date/text()").first.value)) rescue Date.parse(REXML::XPath.match(elem, "pubDate/text()").first.value) rescue Time.now

    item.description_link = item.description
    item.description.gsub!(/<\/?a\b.*?>/, "") # remove all <a> tags
    items << item
  end

  items.sort_by { |item| item.date }
end
I’m just going to replace that with a Nokogiri equivalent. After adding nokogiri to the Gemfile, I just added a parse_rss_nokogiri method:
def parse_rss_nokogiri(body)
  xml = Nokogiri::XML(body)

  items        = []
  link         = xml.xpath("//channel/link").first.text rescue ""
  title        = xml.xpath("//channel/title").first.text rescue ""

  xml.xpath("//item").each do |elem|
    item = RssItem.new
    item.title       = elem.xpath("title").first.text rescue ""
    item.link        = elem.xpath("link").first.text rescue ""
    item.description = elem.xpath("description").first.text rescue ""
    item.author      = elem.xpath("dc:publisher").first.text rescue ""
    item.date        = Time.mktime(*ParseDate.parsedate(elem.xpath("dc:date").first.text)) rescue Date.parse(elem.xpath("pubDate").first.text) rescue Time.now

    item.description_link = item.description
    item.description.gsub!(/<\/?a\b.*?>/, "") # remove all <a> tags
    items << item
  end

  items.sort_by { |item| item.date }
end
And then updated the parse method to call it:
  def parse(url)
    open(url) do |http|
      return parse_rss_nokogiri(http.read)
    end
  rescue
    []
  end
Let’s re-run the profiler and then check out the results:

REXML is no longer in the callgrind trace, and because Nokogiri is so fast, it isn’t either. In fact, our overall page runtime has dropped from 430ms to 164ms - an improvement of 262%.
Conclusion
Using ruby-prof (and request_profiler), I was able to take an app I know literally nothing about, profile it, identify a slow spot in its default page, and improve its runtime by 262%. ruby-prof and kcachegrind rock. Use them.